NOPP 2025 Deployment
Hybrid-style mooring | Collaboration between Scripps' Ocean Time-Series Group and MOD lab, and Del Mar Oceanographic
Wirewalker
Built by Del Mar Oceanographic, the Wirewalker wave-powered profiler uses wave energy from the surface to power water-column profiles of the upper 500 m at 30 cm vertical resolution every half hour [Table 1].
Fig. 1. Contour plots
Contours of T, S, and density from the Wirewalker with RBR Concerto CTD, over the entire deployment, as a function of time (x-axis) and depth (y-axis). Only data from the upcasts are used, and outliers are removed prior to gridding.
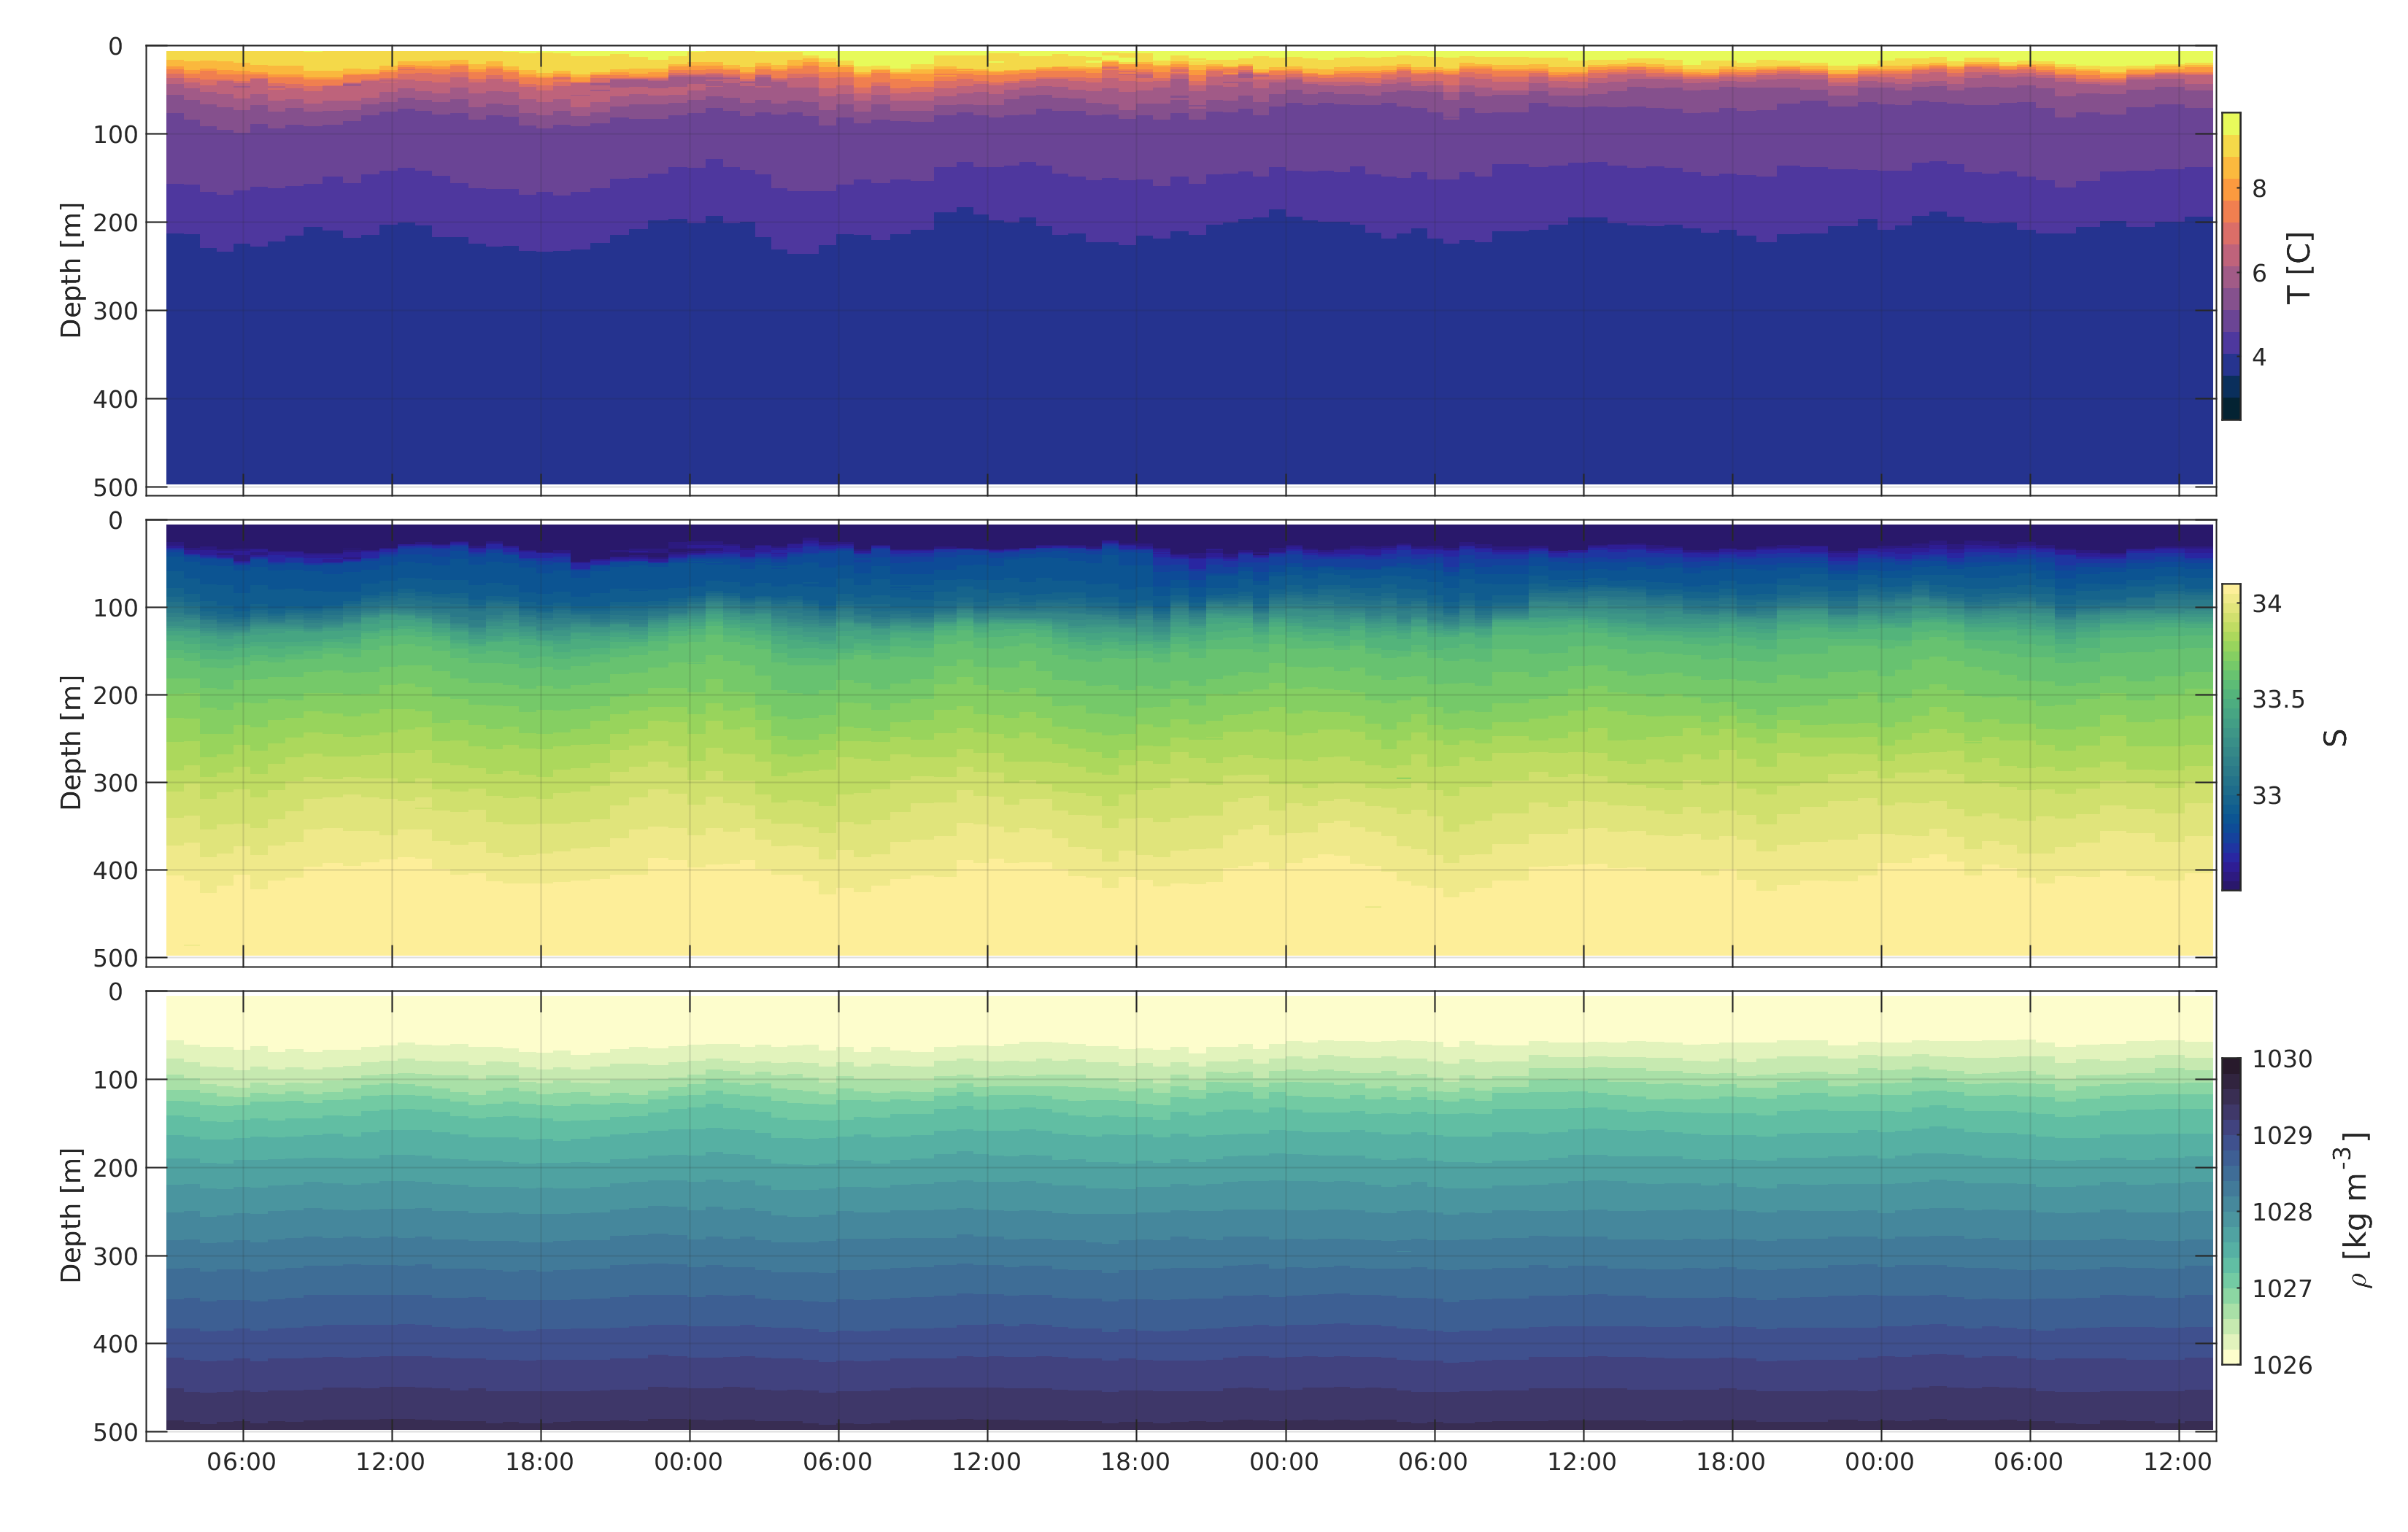
Fig. 2. Time-series plots
Time series of T, S, p, and derived steric height from the Wirewalker with RBR Concerto CTD. Data are logged internally at 2 Hz, and averaged to 0.5 Hz before being telemetered in near-real time. For these plots, the telemetered data are subsampled further to improve browser performance.
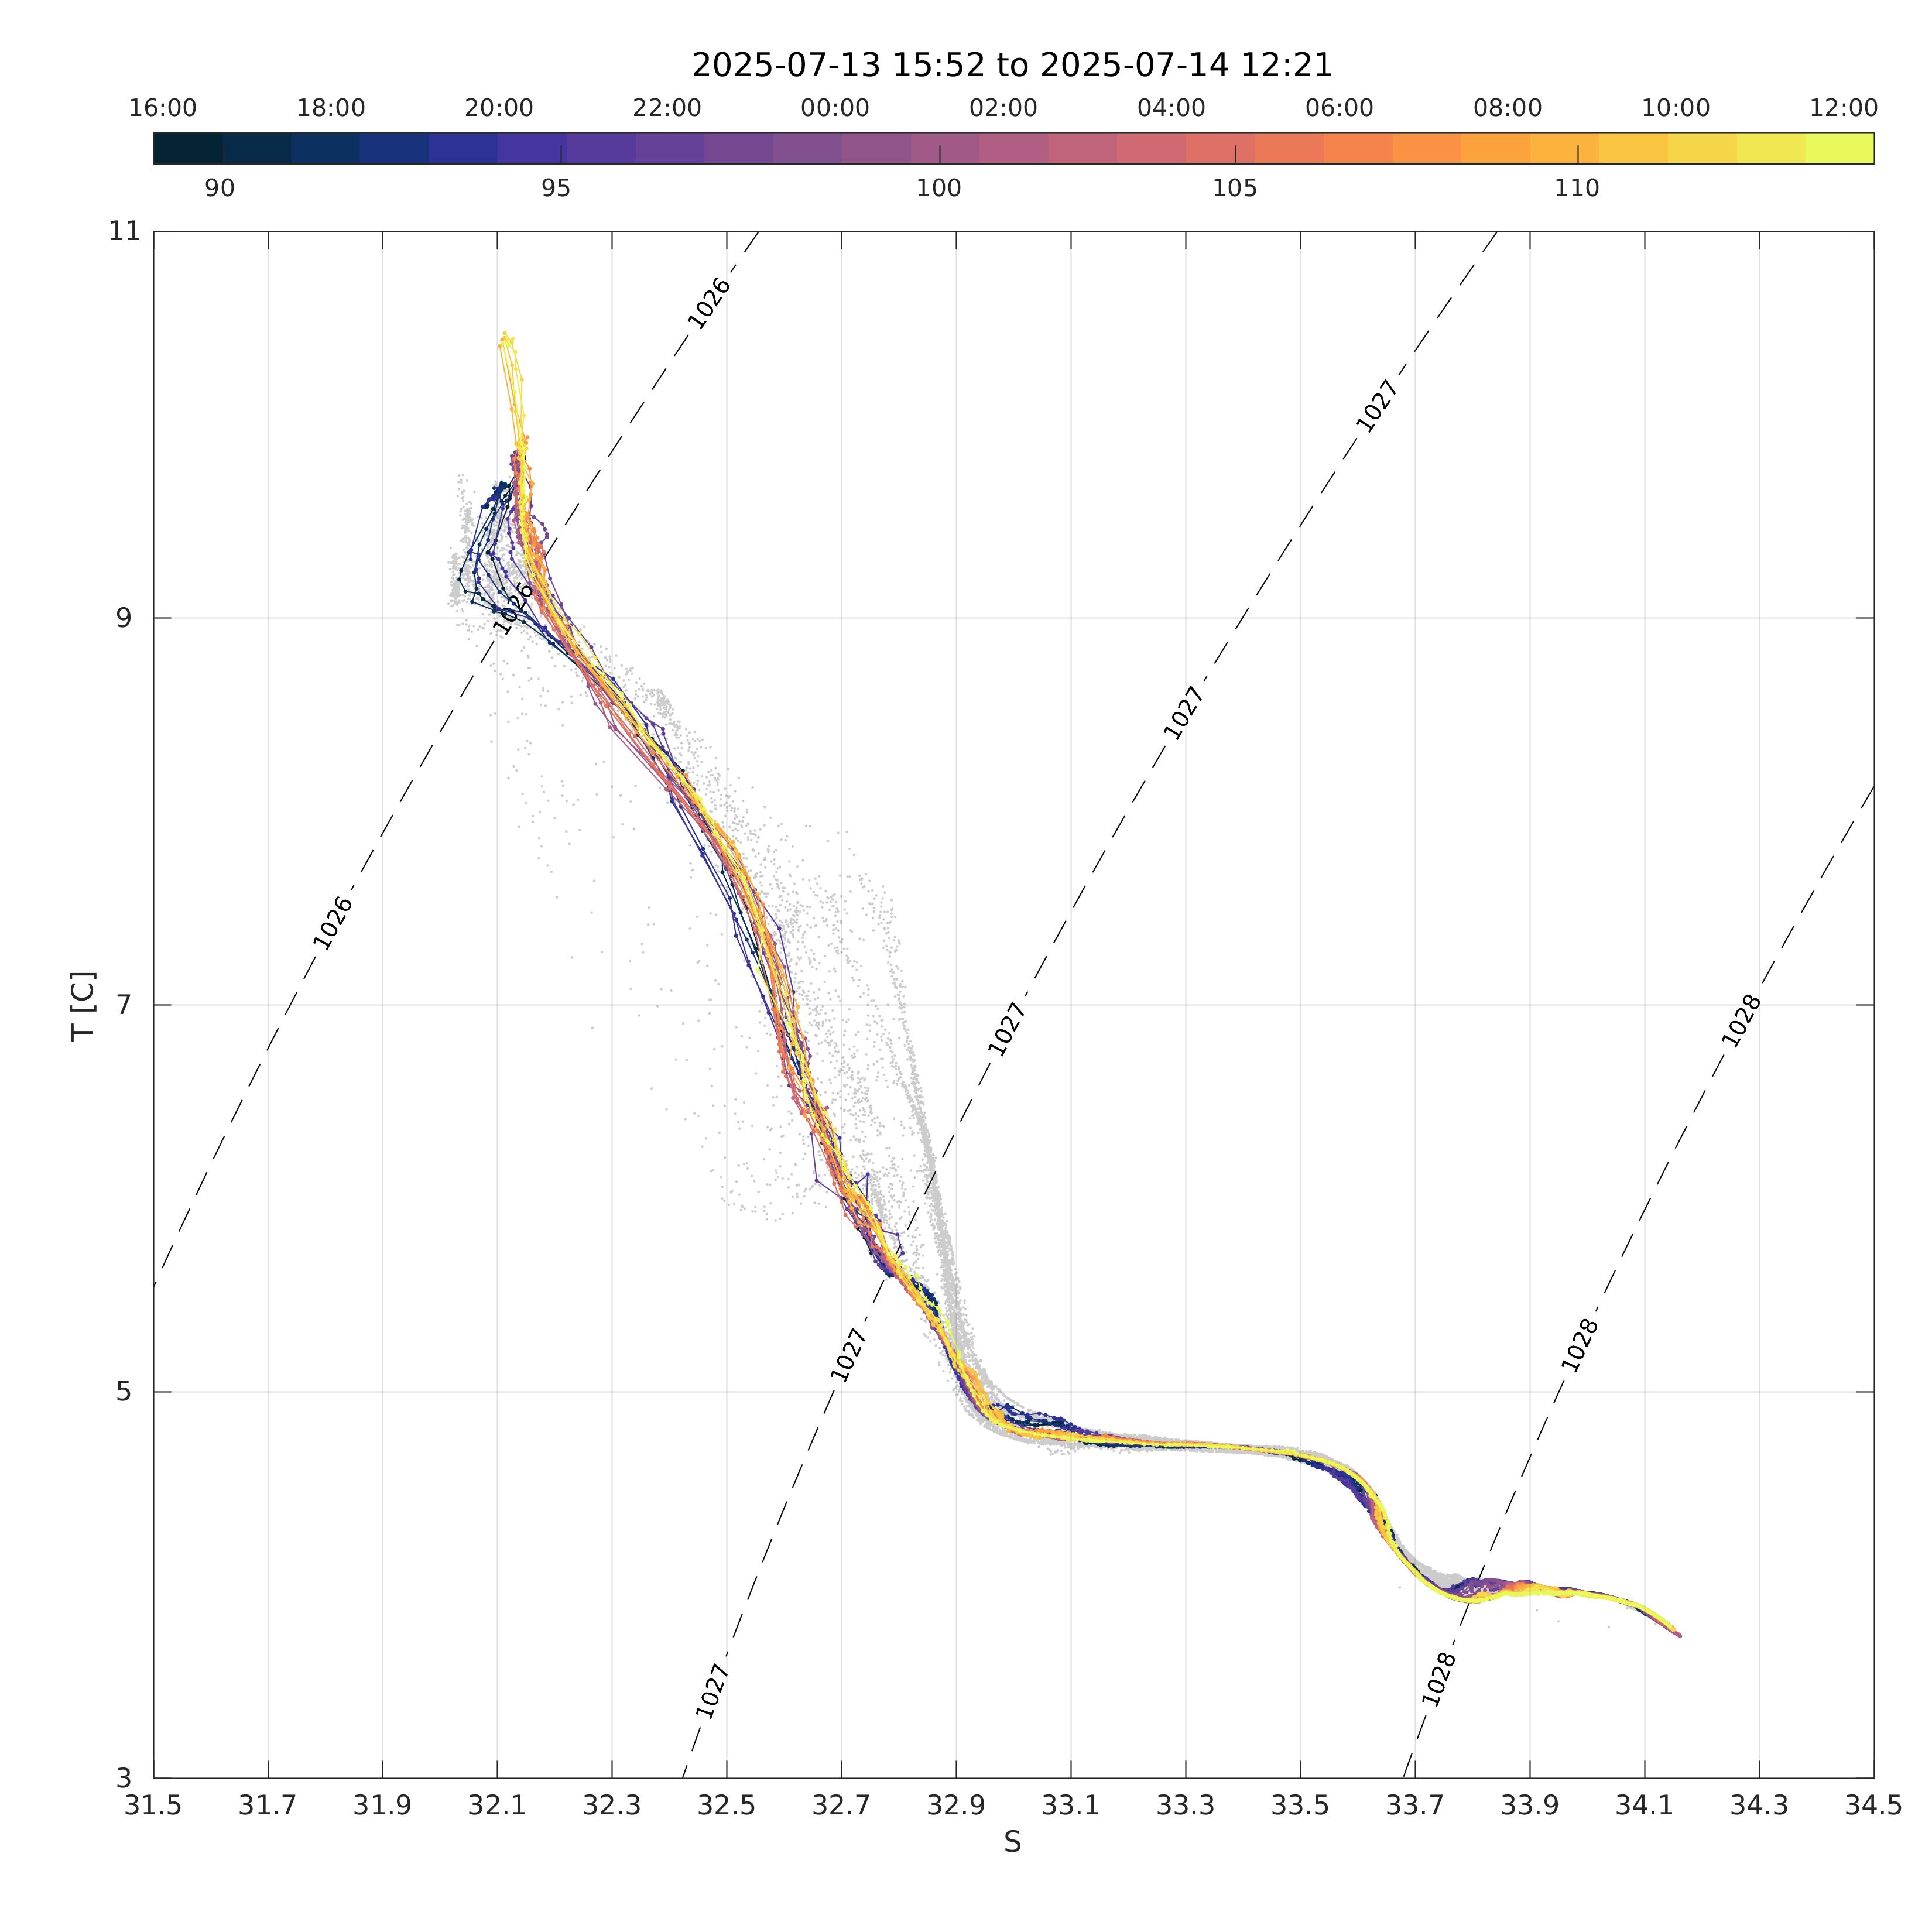
Fig. 3. T-S plot
T-S plot from the Wirewalker with RBR Concerto CTD. Only data from the upcasts are shown.
Data/Website inquiries: jsevadjian@ucsd.edu